
Despite the rapid expansion of solar and wind power, global CO2 emissions continue to break new records.1 Moreover, as regions increase their share of intermittent energy, costs are expected to continually rise due to overbuilding, storage, transmission upgrades, and underutilized fuel-powered backup systems required for reliability. This has generated growing interest in nuclear power because of its inherent reliability.
Nuclear power is notable for its high overnight capital cost, which is offset by its high capacity factor and low fuel cost. However, in a grid powered entirely by nuclear energy, it must meet peak demand. Peak demand can be almost twice as much as the average demand in some regions. Using nuclear power to satisfy peak demand would require overbuilding, which significantly lowers the capacity factor and thus increases costs.
This paper will evaluate the use of batteries, solar, and wind power as complementary resources to potentially reduce the overbuilding of nuclear power and thus reduce the system cost. A complementary effect occurs when combining resources increases their collective utilization rate compared to using each in isolation.
To find the ideal mix of resources, we will use nonlinear optimization. This approach can eliminate guesswork and significantly reduce the time and cost required to achieve policy goals. To represent a variety of climates within the U.S., the study will evaluate the MISO (group of states in the Midwest), Texas, and California grids.
Modeling Intermittent Energy Systems
Intermittent energy is difficult to study due to its random behavior and seasonal variations. To better understand this, the Variational Energy Solver (VES), an Excel-based tool, was developed. VES allows users to define a configuration of energy resources, which it uses as input for simulating intermittent energy production and storage. These simulations can predict generation costs, and the hours of backup fuel required to balance a grid’s load. VES also estimates metrics such as curtailment and land use.
To perform a simulation, VES uses a VBA function that steps through each row of a dataset containing hourly demand and generation data. If generated energy exceeds demand, the excess is stored. If there is an energy deficit, the required energy is retrieved from storage; if storage is empty, gas is used. When curtailment is necessary, nuclear generation is reduced first to minimize fuel costs, giving priority to solar and wind, which have near-zero marginal costs. Transmission and storage losses are accounted for as well.
The EIA supplies the hourly data.2 The EIA provides hourly datasets for demand and every type of electricity generation, for each grid region in the U.S. VES prepares this data by rescaling it to match a user-defined energy configuration for the grid region of interest. VES uses a known capacity factor for the region to guarantee that the capacity factor of the scaled data matches the capacity factor of the region.
VES defines an energy configuration by specifying the annual consumer demand and the values of various scaling factors. For this paper, we are concerned with the following scaling factors: nuclear-overbuild-factor, renewable-overbuild-factor, percent-renewable-that-is-solar, and hours-of-storage.
The nuclear-overbuild-factor defines the amount of nuclear capacity relative to consumer demand. A value of 1 means there is enough nuclear power capacity to produce an amount equivalent to the annual consumer demand. This factor ranges from 0 to infinity. The renewable-overbuild-factor is analogous, but for renewable energy. The percent-renewable-that-is-solar specifies the proportion of renewable energy that is solar; the remainder is wind. The hours-of-storage defines battery storage capacity in terms of the hours it can supply the grid’s average hourly energy demand.
The reason for defining a configuration with these kinds of scaling factors is to enable VES to perform nonlinear optimizations. What makes VES different from many other solvers described in the literature is its ability to perform complex and flexible optimizations. VES is paired with Solver, Excel’s built-in optimizer. To perform an optimization, the user first selects an objective to minimize. Next, a subset of the scaling factors previously described is selected. Finally, constraints are optionally defined.
For example, let’s say we want to determine the lowest cost of a generation mix that guarantees 70% of the energy consumed comes from nuclear power, with the remainder from an ideal blend of solar and wind. First, select the cost of power as the objective to minimize. Next, select the variables that Solver needs to adjust. These are the four variables described previously. Finally, create two constraints: the first is that 70% of the energy must come from nuclear, and the second is that 0% must come from gas. Solver will then use VES to find the ideal mix of solar, wind, and storage, with 70% of the energy coming from nuclear.
With VES and Solver as a team, we can now find the lowest cost of any mixture of nuclear, solar, wind, and batteries able to fully power a grid, without blackouts or gas generation. We can do this for any grid region in the US.
Assumptions
Cost data for solar, wind, and storage come from the 2024 EIA and NREL price guides.3 4 For nuclear power, we use the projected nth-of-a-kind (NOAK) cost, as costs are expected to decrease significantly with repeated new builds. According to this MIT study, the NOAK cost of AP1000 reactors can be achieved by constructing 10 to 20 additional units, resulting in a final cost of $4,625/kW.5 The LCOE of NOAK nuclear is estimated at $66/MWh. In addition, it is assumed that load-following reactors, like the AP1000, will dominate the mix of nuclear power plants. Here are the key assumptions:
Solar power: $1,502/kW, single axis tracking
Wind power: $2,000/kW, onshore
Lithium-ion BESS: $436/kWh, efficiency 90%, DOD 90%.
Storage loss of 5% for DC to AC and voltage step up
NOAK cost of nuclear power: $4,625/kW
Transmission/distribution losses: 6%
Solar power land consumption: 7 acres/MW
Wind power land consumption: 60 acres/MW
Life of a nuclear plant: 80 years
Life of a solar farm: 30 years
Life of a wind farm: 20 years
Effective interest rate (WACC) for financing: 8%
Financing period for a power plant is for the life of the plant
EIA reports from 2020 to 2024 have shown that prices for utility-scale storage, solar, and wind plants have either fluctuated or risen slightly. 6 7 8 Consequently, it is unlikely these prices will drop in the near future; they may even increase. This is discussed in detail in a previous paper by the same author. 9
However, there is greater disagreement regarding the future costs of nuclear power and storage. Therefore, we will analyze a range of prices to assess their impact on the optimization results. Nuclear power prices will vary from $4,625/kW to $15,000/kW, while storage prices will range from $200/kWh to $436/kWh. Additionally, we will test scenarios that assume ultra-high nuclear costs combined with ultra-low solar, wind, and storage costs to examine a boundary case for using nuclear power.
The resulting costs in this paper are for wholesale electricity. Currently, the average cost of wholesale electricity in the U.S. is around $40/MWh. To find the retail price increase subtract $40/MWh from our projected costs, then divide by 10 to get cents per kWh. For example, a $102.3/MWh in the cost of power means a 6.23 cent/kWh increase in the retail price. We assume wholesale cost increases raise retail prices by the same amount, as utilities pass costs directly to consumers.
A key limitation of this study is that by using regional EIA generation data, and simulating as a single node, there is an implicit assumption of perfect connectivity within the grid region. By mixing energy in a regional grid, seasonal and local variations are smoother. For example, solar is best in the summer when wind is at its worst. Location A may have excellent wind, whereas location B has poor wind. On a different day it might be the other way around.
However, to achieve these complementary effects, the grid must be able to transmit large power spikes generated in the location where weather conditions are favorable, to the locations where weather conditions are poor. The voltage levels of the current grid are not high enough to support this. Therefore, the voltages of the lines and substations must be increased unless batteries are co-located with the solar and wind plants. By co-locating batteries, power spikes are sent to the batteries instead of the grid. While co-location will reduce the need for such upgrades, it will also reduce the complementary effects.
Mixes of intermittent energy above 30% to 40% are when this issue starts to become relevant. The maximum power spike is proportional to the percentage of intermittent energy; thus, the problem gets worse as the percentage of intermittent energy increases. The cost of the voltage upgrades is difficult to estimate and is not included in this paper. However, the cost of these upgrades can easily raise the total cost of electricity by more than $100/MWh, depending on the percentage of intermittent energy. This topic is discussed in more detail in this paper.10 Please read the section “The super grid.”
The ideal mixture
The objective of this section is to find the lowest-cost configuration for a CO2-free grid that can satisfy peak demand, then analyze how varying prices for nuclear power and storage influence the overall cost of power.
Figure 1 below shows the results for the MISO grid. The solar capacity factor is assumed to be 24.3%. The peaking-factor is 1.59. The peaking-factor is defined as the highest hourly demand of the year, divided by the average demand. It gives us a measure of how difficult it is to satisfy peak demand.
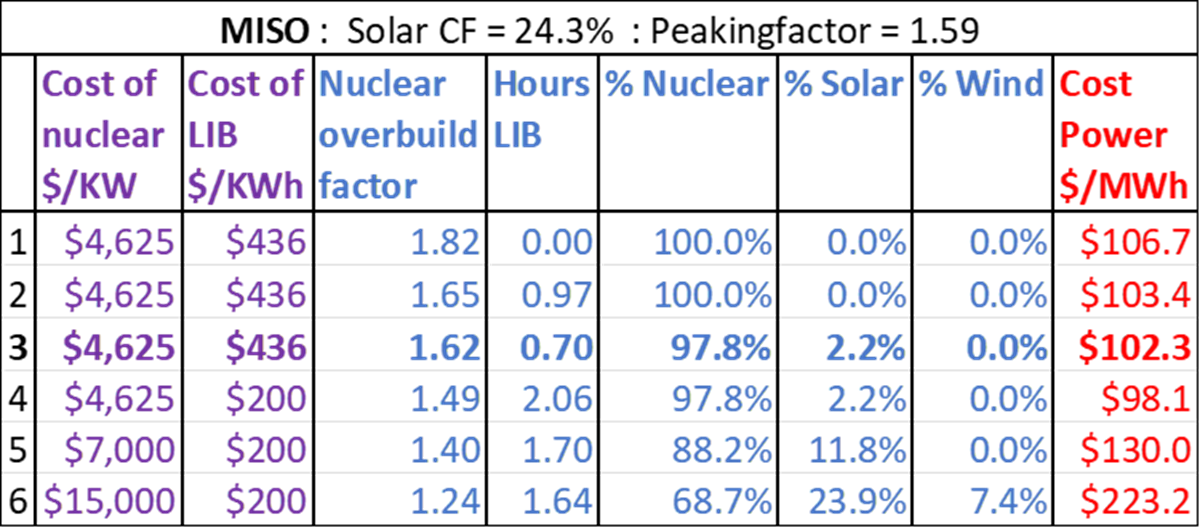
Scenario 1 is for 100% nuclear power with no storage. The nuclear overbuild-factor is 1.82. The cost rises to $106.7/MWh, compared to the projected LCOE cost of $66/MWh for nuclear power, and the base wholesale cost of power at $40/MWh. In Scenario 2, the optimizer is allowed to bring in storage. It determines that 0.97 hours of storage is optimal. This lowers the overbuild-factor to 1.65 and the cost to $103.4/MWh.
In Scenario 3, the optimizer is allowed to bring in solar and wind. It brings in a small amount of solar but no wind. This configuration is 97.8% nuclear and 2.2% solar, with 0.7 hours of storage. The cost is lowered to $102.3/MWh. This is the lowest cost VES can find for a CO2-free grid in MISO with NOAK prices for all resources. This will increase the average retail electricity bill by approximately 6 cents per kWh.
VES discovered a small complementary effect among nuclear, storage, and solar, but nothing for wind. Figure 2 below shows the results of the mix at peak load. Green is for batteries, red is demand, purple is nuclear, and yellow is solar. Notice how the purple peaks are flattened. The green graph shows batteries going from fully charged to drained. The batteries provide most of the peak power. Solar provides a small benefit due to the heavy use of air conditioners during peak load, coinciding with when solar performs well.

Scenario 4 shows that if the cost of storage is lowered to $200/kWh, the cost of power decreases to $98.1/MWh. The lesson here is that cutting the cost of storage by more than 50% will only lower the cost of power by about 4%. In scenario 5, we increase the cost of nuclear to $7,000/kW. The optimizer then brings in more solar for a total of 11.8%, but still no wind.
In Scenario 6, increasing the cost of nuclear to $15,000/kW, while maintaining storage at $200/kWh, results in a mix of 68.6% nuclear, 23.9% solar, and 7.4% wind. Cost of power more than doubled compared to the optimal case with NOAK pricing. In spite of the artificially high cost of nuclear and low cost of storage, the optimizer still prefers nuclear power as the backbone of the grid. Note that in all scenarios storage never rises much above 2 hours. The benefit of storage is real, but modest.
Figure 3 below shows the results for Texas (ERCOT). Scenario 3 is optimal with NOAK pricing. Heavy use of air conditioners brought in more solar power compared to MISO. The remaining scenarios show a similar pattern to those in MISO.

Figures 4 thru 7 show load balancing the Texas grid under various conditions. Figure 4 below shows the grid at near-load peak conditions with storage, but no solar. The batteries are able to slightly flatten the nuclear power peaks, resulting in a modest saving of about $3.5/MWh.

Figure 5 below shows the case when solar power is included in the mix. The nuclear power peaks are flattened a little more, for a total reduction of $9.9/MWh compared to the case with storage only. Notice how adding solar power reduces the amplitude of nuclear power fluctuations compared to the case with storage only. This makes load balancing a little easier for the nuclear plant.

Figures 6 and 7 show load balancing of nuclear power in the winter. In Figure 6, there is no solar. In this case, nuclear power perfectly follows the demand curve, while storage is never tapped.

In Figure 7, solar is added to the mix. This causes the nuclear plant to work harder to save fuel and utilize available solar energy.

The lesson learned is that adding solar power eased nuclear load balancing in the summer but made it harder in the winter. Thus, there is no net advantage or disadvantage to adding solar with respect to its effect on nuclear power load balancing. This finding is valid only assuming that the optimal amount of solar is used.
Figure 8 shows the results for California. The results are very similar to those of Texas. Scenario 3 shows the optimal case with NOAK pricing. However, the inclusion of solar power only reduced the cost of power by $1.6/MWh, far less than the case for Texas. This is likely due to heavier use of air conditioners in Texas, as California has mild summers.

Finally, Figure 9 shows the results when we assume $15,000/kW for nuclear power, $200/kWh for storage, and $1000/kW each for solar and wind power. This uses the first-of-a-kind (FOAK) cost for nuclear and approximately half the NOAK cost for storage, solar, and wind. The optimizer brings in more storage, solar, and wind compared to previous scenarios, but nuclear power still dominates all three grids, even in this extreme case.

The effects of renewable energy mandates
Regional mandates often require CO2 reductions to be met by a schedule of specific dates. In addition, some mandates require the mix of resources to satisfy arbitrary constraints. For example, the state of Michigan requires that by 2040 its grid must be CO2 free, and that 60% of the mix must come from renewable energy. Consequently, nuclear power is limited to no more than 40%. It is unclear what the logic of this constraint is.
The purpose of this section is to analyze the cost of CO2 free power starting from the optimal mix, then slowly reducing the allowable amount of nuclear energy by 10% increments. At each step, the percentage of nuclear energy allowed is constrained, but the optimizer finds the lowest cost mix for the remaining resources. This is shown in Figure 10.
Recall that perfect connectivity of the grid is assumed. This is relevant for scenarios with high percentages of renewables (5 to 13). Hence, without upgrading the voltage of the power lines, batteries will have to be co-located with plants, thus reducing complimentary effects. In this case, actual costs will be higher than those depicted for these scenarios. However, even with the upgrades, costs will be higher when the cost of the upgrades are included.
The results are shown in Figure 10 below. These are for the MISO grid, which includes Michigan. MISO is a good proxy region for the U.S. because both its solar and wind power capacity factors are near the average for the country. Scenario 1 is the optimal case where the cost is $102.4/MWh. Scenario 7 is for 40% nuclear and 60% renewable; the cost rises to $133.1/MWh. This is the most nuclear power that is allowed under Michigan law.

Observe the change in the nuclear overbuild factors from scenario 1 to 7. The optimizer is maintaining most of the nuclear capacity. There is only a drop in nuclear capacity of about 22%. So even though 60% of the energy comes from renewables, nuclear is there to step when weather fails to provide. The added value of the renewables is to save fuel costs, but fuel costs are typically less than 10% of total nuclear power costs. Hence, in order to satisfy the minimum renewables constraint, we end up with excessive overbuilding of nuclear, while operating it with a low capacity factor.
Costs continue to rise until at 0% nuclear the cost is $465.5/MWh. The optimizer holds on to most of the nuclear power capacity until the 0% mark. If we force the optimizer to rely on less nuclear power capacity, the total costs will be significantly higher. The cost increases are due to difficulty of achieving reliability when weather conditions are increasingly further away from ideal.
Figure 11 below shows scenario 12 where nuclear power is providing 2% of the total energy. The graphs depict what the Germans call dunkelflaute (winter doldrums). Dunkelflautes are periods where there is simultaneously little wind and solar. In this dunkelflaute the wind disappeared for three days, while solar was chronically below demand. Even though nuclear was only providing 2% of the energy, it is cheaper to use nuclear as a reserve resource than to overbuild the solar, wind, and batteries enough to balance load.

Let’s go back to Figure 10. Notice the abrupt shift from wind power to solar when comparing scenario 12 to 13. We transitioned from 13.3% solar to 83.6% solar. This also resulted in a large shift to more storage. Figure 11 helps understand why the optimizer made such a shift. Overall, wind energy is a cheaper source of energy compared to solar. However, due to extreme wind dunkelflautes, in 100% renewable scenarios solar power is better able to handle the worst case conditions. Since these extreme wind dunkelflautes are uncommon, they only have to be load balanced without dispatchable backup power in the 100% renewable case.
This creates a paradox: do you pay higher costs for power to maintain suboptimal percentages of solar power in order to prepare for the day when the grid is finally powered 100% by renewable energy? It is clearly implausible to make such a shift in real life.
Column 7 of Figure 10 shows the percentage of land used. This is all of the land in the U.S. not counting Alaska. Scenario 12 shows a high number of 12.29% due to the large percentage of wind power. Scenario 13 shows the results of the abrupt shift back to solar. The optimal 100% solar and wind scenario requires 4.45% of the land mass of the lower 49 states. Consider that this is only for decarbonization of the current grid. This percentage will be significantly higher in a true net zero case.
Next, we consider the case with only nuclear, solar and batteries as depicted in Figure 12 below. The assumption of perfect connectivity in the grid is less relevant here. This is because all solar plants, within some grid region, have a high degree of correlation. Hence, the costs here are more realistic. Here we can assume batteries are co-located with plants to reduce the need for grid upgrades, as there is not a lot of difference in the cost between that vs using regional storage to achieve small complementary effects.

Costs for solar only scenarios are significantly higher than those depicted in Figure 11. This is due to the lack of complementary effects. At the 40% nuclear case, the cost is $282.6/MWh compared to $133.7/MWh when wind is allowed, and perfect connectivity is assumed. Since few complementary effects are assumed, the grid does not require expensive voltage upgrades. However, more power lines will still have to be built in order to connect solar plants in rural areas to the main grid.
In the solar power only grid, the optimizer relies much less on nuclear capacity as a backup compared to when wind is allowed. The reason is because without the complementary effects of the wind power, making solar reliable requires substantially more batteries. This required storage alleviates the need for nuclear backup. Land use for 100% solar is 2.83% due to the excessive overbuilding of solar.
The pragmatic approach
We learned in previous sections that when nuclear power has to satisfy peak demand, its cost rises from $66/MWh, to just over $100/MWh (depending on the region and mix of resources). For solar and wind power, the costs rise dramatically when having to load balance dunkelflaute. In all the previous scenarios the results are for configurations that generate zero CO2 emissions. If we relax this restriction a bit, costs can come down significantly. The reason is that natural gas is an ideal source of energy to handle both peak loads and dunkelflautes. This is due to its dispatchability and low capital cost.
In this section we will explore a pragmatic approach to decarbonization. It’s important to understand that CO2 emissions from generation are not all the emissions. There are more emissions associated with mining and manufacturing of the components of the energy system. We will call these emissions the Life Cycle Assessment (LCA) emissions. So, the total emissions are emissions from generation + LCA emissions. For baseline comparisons, 100% natural gas combined cycle generation is assumed to emit 464 gram-CO2/kWh, including its LCA emissions.
NREL has a 2024 study that estimates the LCA emissions of solar farms.11 Here is a meta-study estimating the LCA emissions of manufacturing lithium-ion batteries. 12Here is the LCA emissions of wind power13, and here is for nuclear power.14
VES is able to total all of the components required to achieve a specific policy goal. By using the LCA emissions from these papers for the components, VES can then estimate the total CO2 emissions resulting from achieving policy goals. In all the tables in this section, the CO2 emissions are the total emissions, expressed as grams-CO2/kWh. All results in this section are for the MISO grid.
Figure 13 below shows the cost and CO2 emissions from an optimal mix of solar, wind, natural gas, and storage. The cost of using zero gas is $465.5/MWh. This falls to $218/MWh with 2% gas, and to $177/MWh with 5% gas. Again, these prices assume that the grid has undergone the necessary voltage upgrades to achieve the complementary effects of mixing solar and wind power as discussed previously. The irony is that by allowing 5% gas, not only did prices fall, but CO2 emissions also fell by almost 50%. The excessive overbuilding of solar and storage required for zero generation emissions, emitted more LCA emissions than the natural gas.

Figure 14 below shows the cost and CO2 emissions from an optimal mix of solar, natural gas, and storage. Since this is for solar only, no complementary effects are assumed, hence these costs do not require voltage upgrades, only the new power lines needed to connect to the solar farms. Prices are significantly more expensive, but costs and C02 emissions are both lower when allowing 5% gas.

Figure 15 below shows the cost and CO2 emissions from an optimal mix of nuclear, natural gas, and storage. Once we allow gas, the optimizer no longer brings in any storage. The 5% gas scenario reduced costs significantly, with only a small increase in CO2 emissions. In addition, this scenario emits less than half the CO2 emissions of a grid powered 100% by an optimal mix of solar, wind, and storage. The 5% gas approach reduces CO2 emissions by over 90% from the 100% gas baseline, with only a 3.9 cents/kWh increase in retail price of electricity.

Conclusion
This paper showed that in the three regions evaluated, the cheapest way to power a grid without generating CO2 emissions is to use 97.2% to 87.8% nuclear power, and solar for the rest, with about 0.6 to 2 hours of battery storage. This range is highly dependent on the climate of the region. Solar power has a small complementary relationship with nuclear, due to the use of air conditioners in summer, when solar power is simultaneously most effective. However, it should be noted that the benefit of including storage and solar power is small.
A sensitivity analysis revealed that if we use an unrealistically high price for nuclear power, and unrealistically low prices for solar, wind, and storage, prices are still lowest when nuclear energy is the predominant source of power. This shows that even nuclear plants that had huge cost overruns, such as Vogtle 3 and 4, will still be a cost effective way to reduce CO2 emissions compared to solar and wind power.
Eliminating CO2 emissions is going to be extremely difficult to achieve. Policy makers add to these difficulties by creating arbitrary rules as to how clean energy should be generated. For example, we have seen that by limiting the use of nuclear power, costs rise without any benefit to the public or environment. Policymakers should focus on goals, then let the private sector implement the solutions.
We compared the cost of using a high percentage of solar and wind power to using only solar power. The cost for the solar and wind combination was significantly cheaper due to complementary effects. However, to achieve these complementary effects, the grid will have to undergo very expensive and disruptive voltage upgrades. Without an accurate accounting for the costs of such upgrades, it is not clear if it is worth doing. The current trend is to forgo upgrades and co-locate batteries instead
Finally, if we use nuclear energy to power a grid, and allow a small amount of CO2 emissions during generation, we can reduce total CO2 by over 90%, with an increase in the price of retail electricity by only about 3.9 cents/kWh. In contrast, a CO2-free grid powered by solar and wind can result in price increases of 30 cents/kWh or more, with higher total CO2 emissions. These costs increases will be devastating to industry and lower income consumers. In addition, the solar and wind option will require substantial land use.
The key to making nuclear power cheap is to focus on reducing its overnight capital cost. To do this we first need to get to NOAK pricing. This is achieved by building a highly competitive nuclear industry. Temporary subsidies may be required to get it started. Second, we need to streamline nuclear regulations to make the construction of plants faster and cheaper, even beyond NOAK conditions. Nuclear power used to be cheap and fast to build. There is no valid reason this can’t be true in the future. Here is an analysis suggesting ways to make nuclear power cheap again.15
From the description within, and the references provided, anyone with basic programming skills should be able to replicate the results of this study.
Thanks for another thoughtful, well reasoned analysis. Your work helps readers see the logic (or lack of it) behind various energy mix scenarios in the regions specified and seems refreshingly free of biases.* I think it deserves to be brought to the attention of decision-makers far and wide.
*Disclosure: I try to avoid jumping to conclusions, but in recent years of persistent research/reading on energy I've come to the conclusion that nuclear power is the most viable solution (generally) for meeting fast-rising energy demands, stabilizing grids, and reducing emissions (CO₂, GHG)
while keeping costs as reasonable as possible to most consumers. Of course, there are many variables depending on where people live and what other energy generation options are available (hydroelectric, geothermal, etc).
Very interesting, sir. Thank you. Some observations.
First, from a perspective of readability, a table of acronyms would be helpful. While most we can figure out, it would be better if it were clearly defined.
Second, it would be intriguing to see how waste disposal influences your results. There is great uncertainty in spent fuel disposal, but relative certainty in disposal of wind and solar. Both costs can be reflected in land requirements. Because both require more land for development, and both will require more land for waste disposal, it would be interesting to compare the costs with those who are constantly fretting over the costs of spent fuel disposal.
Third, and finally, it would be interesting to frame your results in terms of carbon emissions. As a follower of your work, sir, I know that you pay little attention to IPCC scenarios and other such prognostications. That said, the rest of the world does consider carbon emissions. For example, if you looked at James Conca's "apples-to-apples" analysis published a couple of years ago, the kilograms of carbon per TWH for nuclear is half that of wind, and nearly three times as less as solar.
You also need to include life-cycle costs of batteries in this evaluation. Typical shelf life is considerably less than other sources (~10 years). While land requirements are small, carbon emissions for battery manufacture are extensive. I do not know if batteries will require unique treatment in waste disposal (i.e., toxic, hazardous, or general landfill).
Thank you again. I look forward to your next post.