

California is ideally suited to power its electricity grid with solar energy. Despite having the largest population of any U.S. state, its per capita electricity consumption is among the lowest, largely due to its mild year-round weather and minimal heavy industry. The state’s abundant sunshine, clear skies, and deserts near major population centers create perfect conditions for solar power. Additionally, California’s political climate strongly supports renewable energy, with a supermajority prioritizing climate change. As one of the world’s wealthiest regions, it has ample resources to invest in solar infrastructure.
California consumed around 303,200,000 MWh of electricity in the last 12 months; this includes the estimated consumption from electricity produced by rooftop solar. This is low considering how large the population is. Texas, for instance, consumed around 458,000,000 MWh with a 25% smaller population.
For CO2 emissions, when compared to the rest of the U.S., California is doing fairly well. According to the most recent data from the Energy Information Administration (EIA), in the last 12 months, CO₂ emissions generated by California’s grid average 192 g/kWh, while Texas is at 323 g/kWh, and the national average is 339 g/kWh. However, even before its energy transition, California was well below average. This is due to its large amounts of hydroelectric and nuclear power, and it has never used much coal. California began its energy transition around 2010, with a rapid expansion of wind and solar energy.
California has a legally binding goal of having a CO2-free grid by 2045. Renewable energy advocates portray it as a model for the rest of the nation to follow. But is it positioned to make rapid progress, or has it already plucked the low-hanging fruit? Below is the situation up to 2020.1

The EIA collects extensive data on how electricity is generated in the U.S. over the last six years.2 This article will analyze this and other relevant data to understand the current trends in California and what to expect in the future. The EIA data captured spans from May 2019 to May 2025. A glossary is provided in the appendix.
The current trends
In this section, we will calculate linear regressions using the most recent six years of data provided by the EIA on California’s electricity generation. Linear regression is a common technique in statistics to find a trend that is the best fit to represent fluctuating data. Readers should avoid the temptation of placing too much significance on the most recent year because data can vary for many complex and unknown reasons.
We start with the most troubling trend. Figure 2 shows that CO2 emissions from electricity generated in-state have been slowly rising.

On the other hand, Figure 3 shows a slightly decreasing trend for CO2 emissions from electrical sources consumed in-state. If emissions continue to decline at the current rate, California will reach zero emissions on its grid in 145 years.

Figures 2 and 3 seem to be contradictory, but Figure 4 resolves the conflict. The electricity California exports shows an increasing trend of higher emissions, while the emissions from imports are decreasing. If the goal is to reduce CO2 emissions, why does California export any? They don’t need to export gas-generated electricity to stabilize their grid. The answer is that these exports reduce overall costs when out-of-state consumers help pay the fixed costs of maintaining the gas plants in-state. Politically, this works as long as the CO2 emissions accounting is for in-state consumption only.

Figure 5 shows the trend for electricity consumption. This does not include consumption from energy generated by rooftop solar. If this trend continues, electricity consumption will rise by about 40% in 2045.
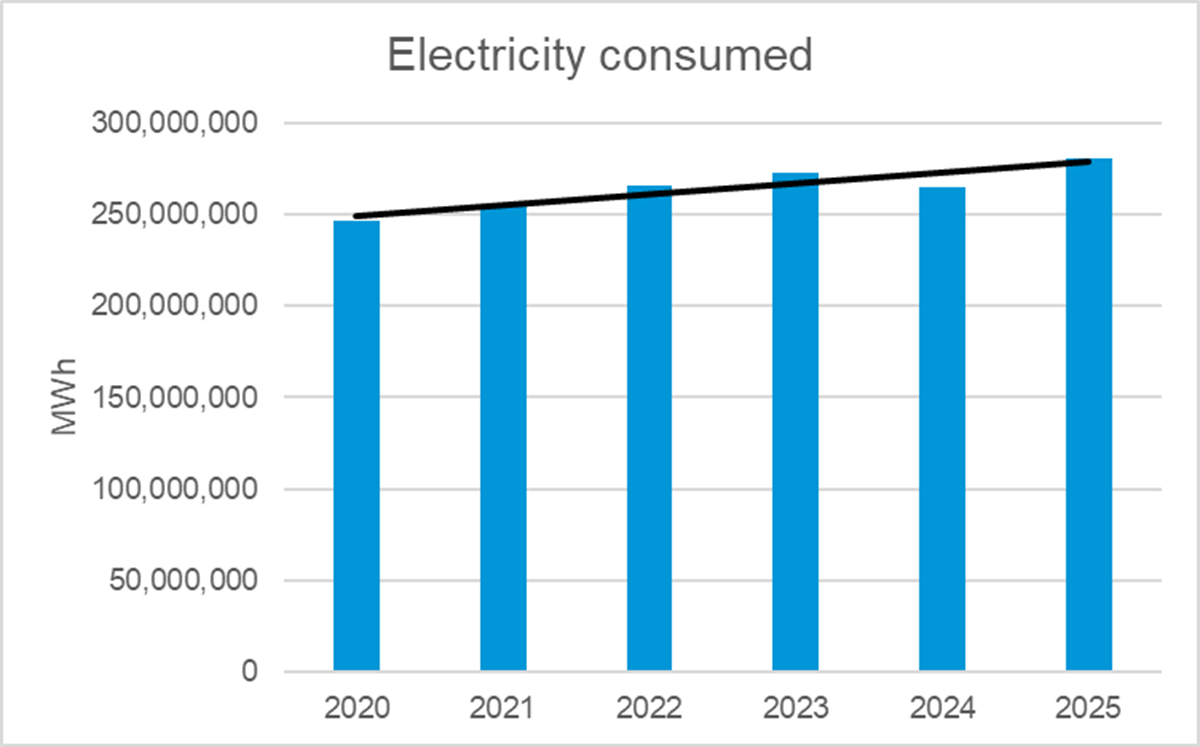
Figure 6 shows the current mix of electricity sources consumed in the last year. These percentages include energy produced by rooftop solar. The data for rooftop solar is an estimate since no government agency tracks it.3
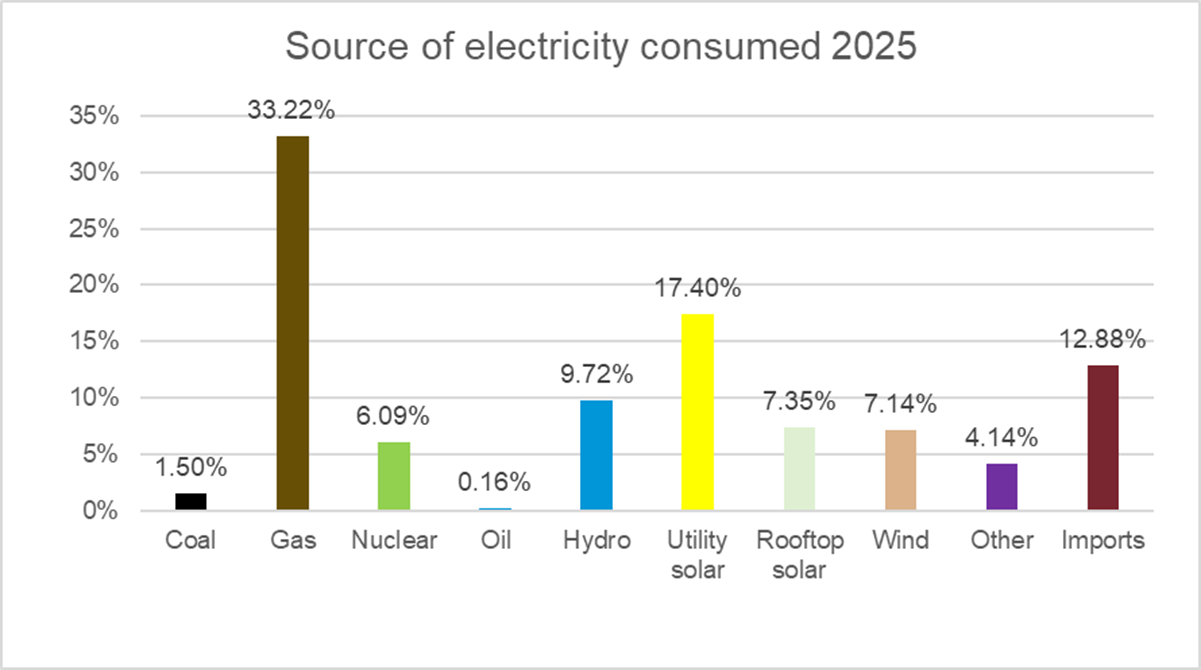
California has some geothermal and biomass energy sources, not shown in Figure 6; the EIA only recently began tracking them. This data is represented in the “other” category. In addition, as of April 2025, California has a total of 15,763 MW of lithium-ion battery capacity.4 This is mostly utility-scale (13,246 MW) but includes a small amount of commercial (686 MW) and residential (1,829 MW) as well. There is no mention of the storage capacity, but lithium-ion batteries typically store 2 to 4 hours of energy. Using 3 as an average, this stores enough energy to power the California grid for about 80 minutes.
The EIA does not track sources of imports. For that, we use the latest data available from the California Energy Commission (CEC).5 This is shown in Figure 7. This data is for 2023, but the percentages in 2025 are likely very close.
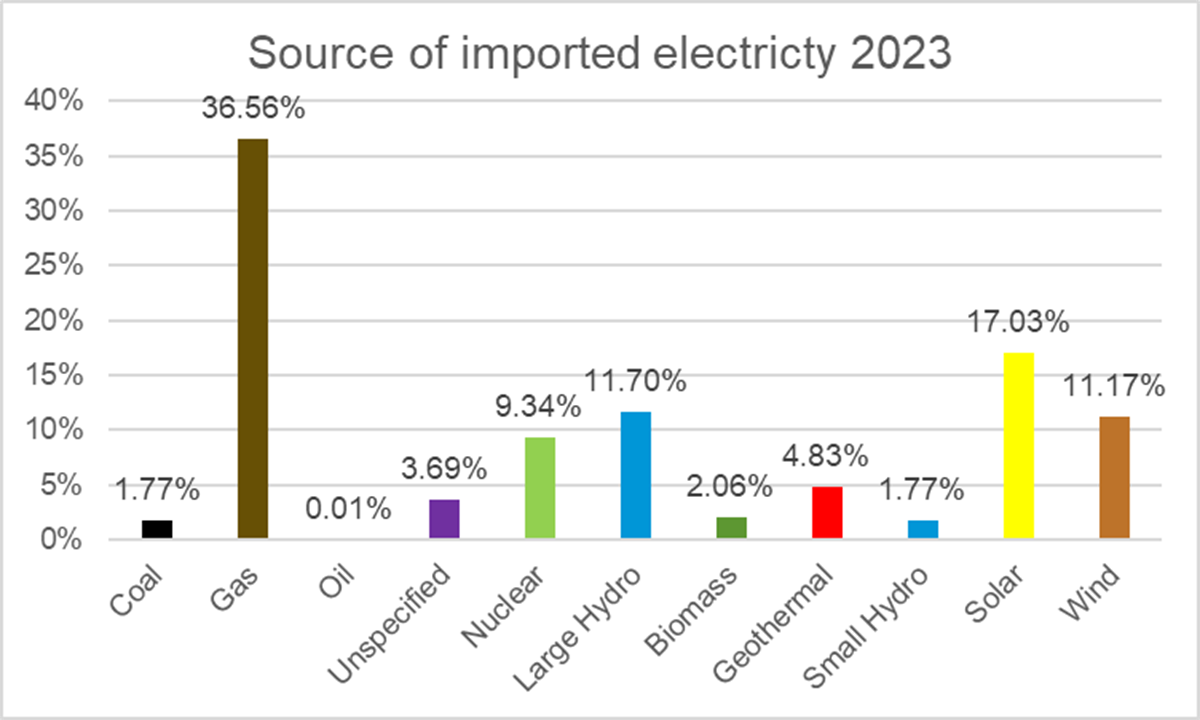
An interesting and often overlooked fact is that California imports a significant amount of nuclear energy from Arizona—an amount equivalent to the output of a large-scale nuclear plant. California utilities collectively own nearly 30% of the Palo Verde Nuclear Generating Station in Arizona. With three reactors, Palo Verde is the largest nuclear power complex in the United States. As a result, California owns three nuclear reactors, two at Diablo Canyon and one in Arizona.
Figure 8 shows that the trend of electricity generated from natural gas is still rising. To keep CO2 emissions falling in-state, some of this electricity must be exported. Natural gas plays a critical role in compensating for the fluctuating outputs of the solar and wind farms.
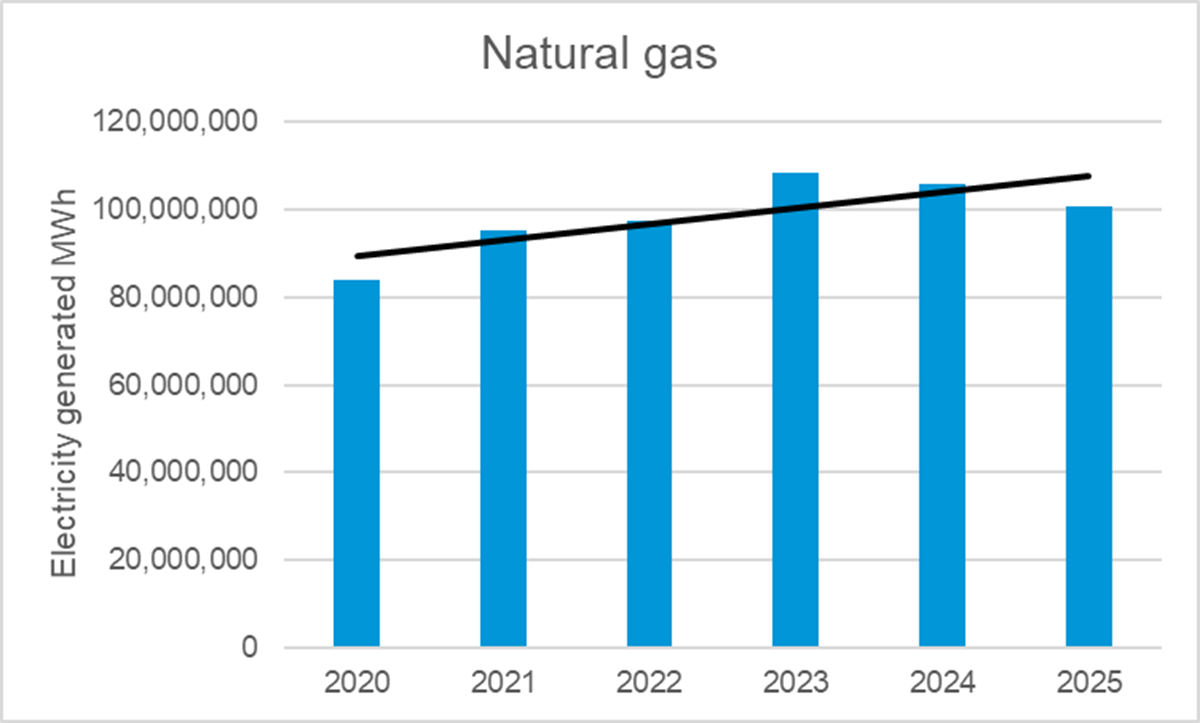
Figure 9 shows that wind power consumption has increased by approximately 1% over the past 6 years. California is not a great state for wind energy. Wind speeds are below the national average, and due to its rugged terrain, there are not a lot of good locations for wind farms.
Note that when calculating the percentages of total consumption in Figure 9, rooftop solar consumption was excluded from the total consumption due to a lack of historical data. This is why the percentage for 2025 is higher than the one in Figure 6. Here, we are more interested in the trend. This discrepancy applies to all the following charts showing percentages.
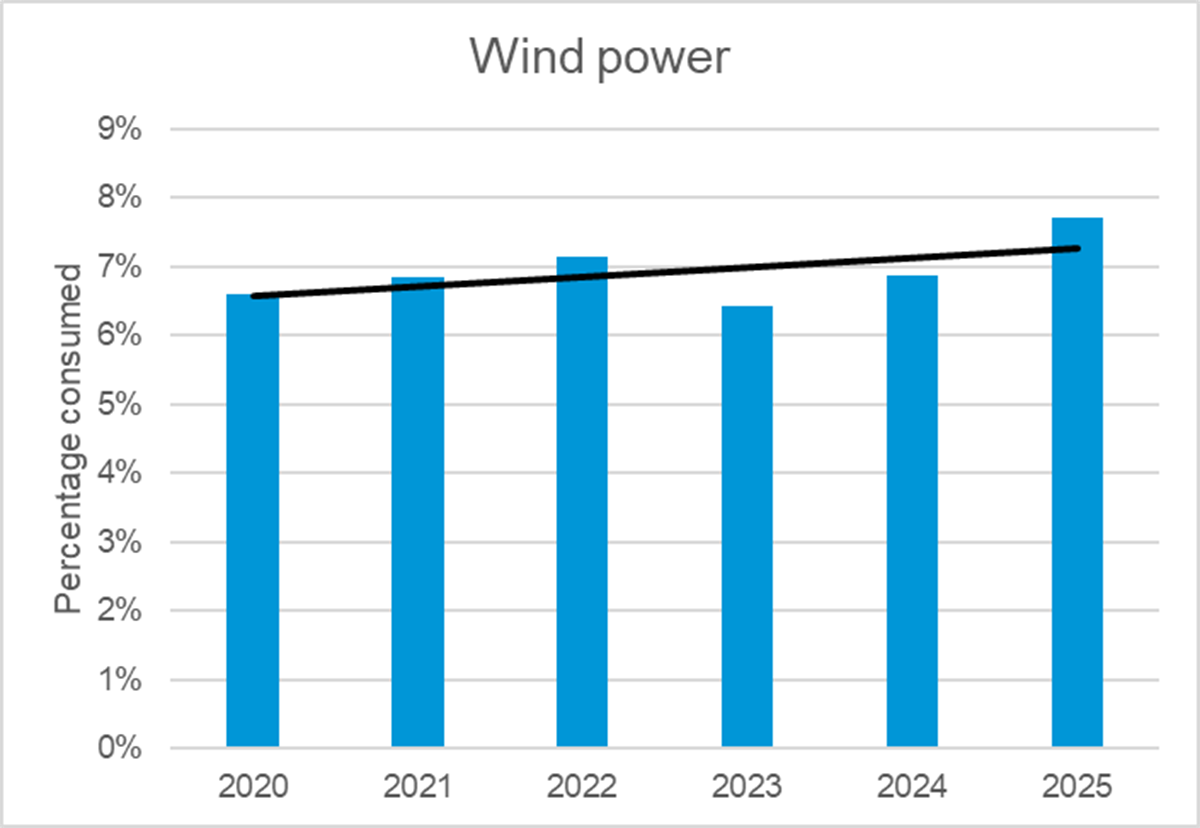
Figure 10 illustrates that solar power consumption is rising at a rate of 1% per year.
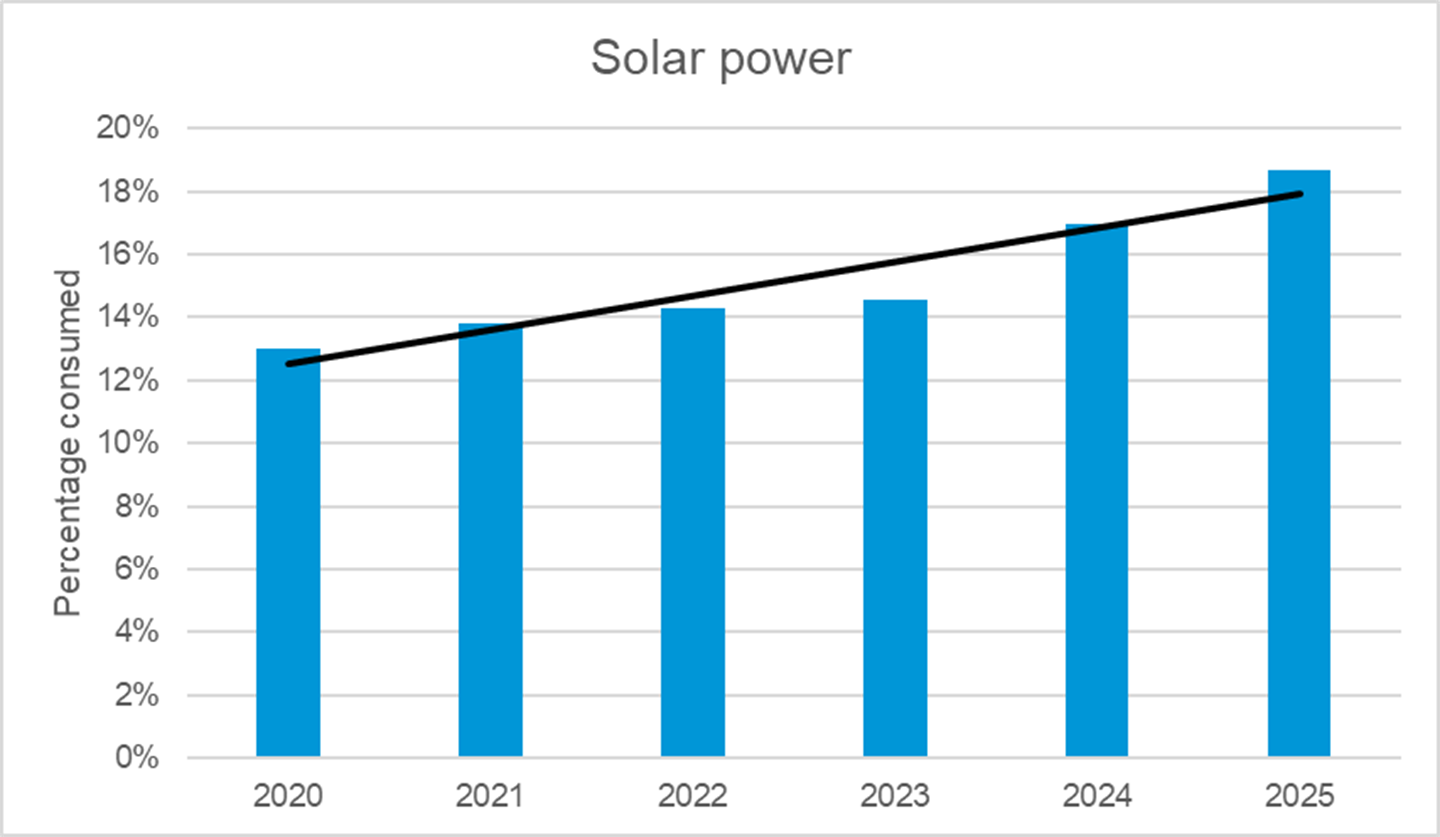
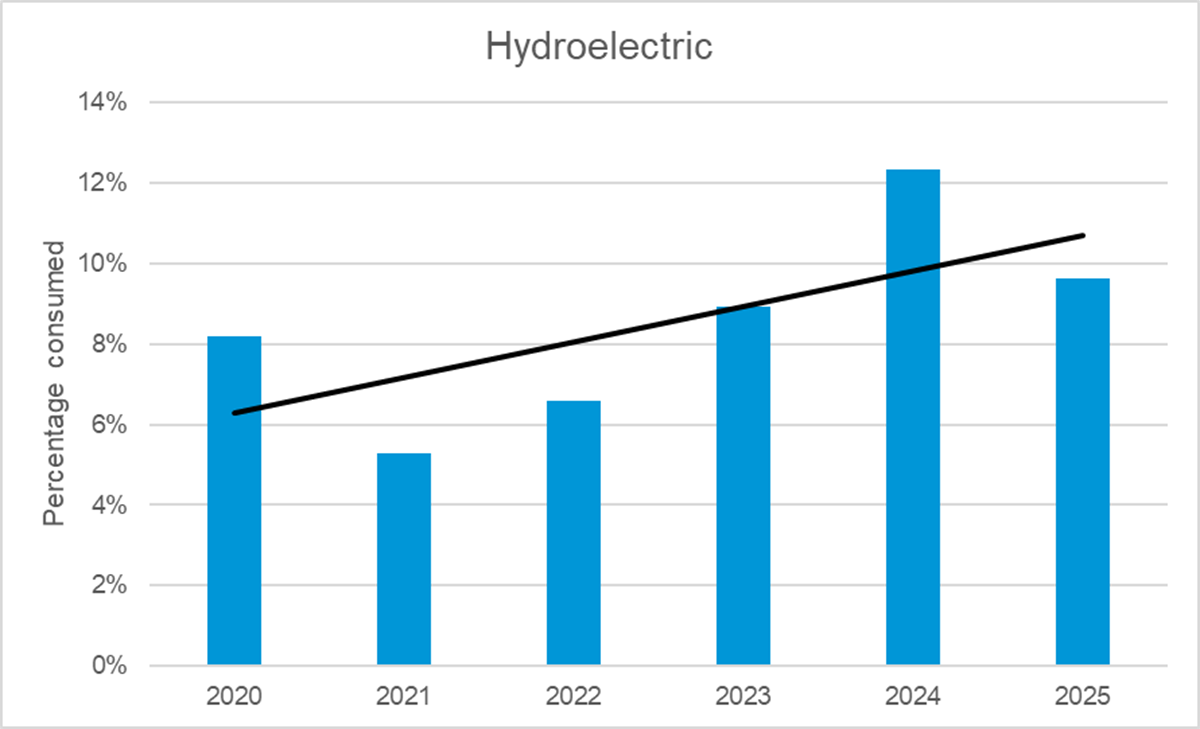
Figure 11 shows that hydroelectric consumption is rising, but this is not due to an increase in the construction of hydroelectric capacity. It has been decades since California built any significant hydroelectric infrastructure. In fact, there is a growing movement in the state to dismantle dams due to their destructive impact on ecosystems. The increase is due to above-average precipitation in the last several years. This will fluctuate. When droughts inevitably return, California will lose some of this low-cost, emission-free resource.
Prospects for new renewable energy
The charts above show that solar power is growing, but not nearly enough to achieve a CO2-free grid by 2045. Three main factors are contributing to slow growth:
1) The increasing share of solar energy is causing grid congestion. There is often more power than can be consumed on sunny days during the spring when demand is low. This situation will get worse as more solar power is deployed.
2) Constructing new transmission lines to connect remote solar installations to the grid is a slow and complex process.
3) Finding suitable locations for new solar farms is becoming increasingly difficult due to concerns about the impact on fragile desert ecosystems.
California is planning to import nearly 10,000 MW of onshore wind energy from neighboring states. This won’t bring in a large amount of energy, and the time frame for building the transmission is extreme. For instance, the SunZia transmission project, first proposed in 2006 to import 3,000 MW from the southwest, just started construction in 2023, after a 17-year delay.6 Building a long-distance transmission line makes building a nuclear plant look easy.
In addition to onshore wind, California is planning to build 20 GW of floating offshore wind by 2045. There are two kinds of offshore wind: fixed-bottom and floating. Most of the offshore wind in the world is fixed-bottom. The key difference is that fixed-bottom can be anchored in shallow waters, whereas floating offshore wind must be anchored in deep waters. California has deep water just off its coastline, so floating offshore is its only option.
Fixed-bottom offshore wind costs twice as much as onshore, and floating offshore wind is 50% more than fixed-bottom, exceeding $200/MWh unsubsidized, even before adding storage costs. It’s hard to see how any region, regardless of wealth, can afford this.
Geothermal energy could plausibly grow, but most of the geothermal sites in the U.S. are east of the Sierra Nevada mountains, concentrated in Nevada, Idaho, and Oregon.

Using capital and operational cost data from the National Renewable Energy Lab (NREL) ATB report for 20247, assuming an 8% interest rate, the unsubsidized cost is about $118/MWh. This is about 3 times more expensive than gas-generated electricity. If we apply DOE loan guarantees and the Investment Tax Credit (ITC), the cost comes down to about $67/MWh. This is affordable and much cheaper than solar or wind power because geothermal energy is dispatchable (reliable), requiring no storage.
However, accessing geothermal presents two problems: first, long-distance power lines must be built over the Sierra Nevada to reach it. This will add more costs, and the NIMBYism from building long-distance power lines will have to be overcome. Second, there is a geological limit to the available supply, so it’s not clear how much of this energy California can count on. Other states will be fighting for their fair share.
The 2045 goal for lithium-ion storage is 52,000 MW, just over 3 times the current deployment. This goal is achievable, but it is not nearly enough storage to load balance high penetrations of solar and wind power without significant gas backup.
Another storage option is closed-loop pumped hydroelectric. California has favorable geology for this due to its mountainous terrain. The technology uses two reservoirs at different elevations: electricity is generated when water flows from the upper reservoir to the lower one through a turbine, and the system is "charged" by pumping water back up to the higher reservoir during periods of low electricity demand. Because it is a closed-loop system, it does not rely on a natural water source. Interestingly, California has shown little interest in this technology, preferring lithium-ion battery storage instead. Perhaps the costs are higher than advertised.
Nuclear power would be a great choice for California, but this has been ruled out for ideological reasons. Diablo Canyon, California’s only in-state nuclear power facility, is scheduled to close in 2030. Opponents of nuclear energy are counting the days; the plan is to use Diablo Canyon’s precious transmission infrastructure to connect to as-yet-unbuilt floating offshore wind plants.
The high cost of electricity in California
As of early 2025, the average price of residential electricity in the U.S. is 17.11 cents/kWh versus 32.4 cents/kWh in California. California is almost double the national average.8 Industrial electricity rates are nearly triple the national average. The high price of industrial electricity affects everybody by causing higher prices for goods and services throughout the state. The reasons for California’s high electricity prices are complex, and a lack of public data makes it difficult to completely understand the situation. However, we can explore the main causes.
Figure 13 below shows a pie chart from a report written by the Legislative Analyst’s Office (LAO) explaining how the $39 billion of revenue collected from the electricity bills of California’s investor-owned utilities is spent.9 The chart shows that about 15% of revenue goes to fund public purpose programs unrelated to producing electricity, about 15% for transmission, about 30% for generation, and about 40% for distribution.

Public purpose programs fund activities such as increasing energy efficiency, expediting the adoption of renewable energy sources, supporting the transition to EVs, and providing low-income customers with financial aid. Since none of these activities are directly involved in electricity generation, their costs directly increase the cost of electricity. Considering that this is about 15% of total costs, it can account for about 30% of the cost increase compared to the national average.
Transmission refers to the high-voltage lines connecting power plants to the substations just outside urban areas. Distribution refers to the lower-voltage lines that transmit electricity from the substations to homes and businesses. Transmission and distribution costs are unusually high in California due to wildfire mitigation and the expansion needed to connect to solar and wind farms in remote areas. According to the report, wildfire mitigation alone accounts for about 10% of electricity costs for customers not receiving the discounted rates given to low-income consumers. This can explain about 20% of the cost increase compared to the national average.
Generation costs are higher in California, partly because natural gas is more expensive in this region. Across the U.S., natural gas costs about $3/MMBTU; in California, it’s closer to $4. This is mainly because California has fewer pipelines and storage facilities, plus several other adverse policies that make gas production and distribution more expensive here.
Another reason for higher gas generation prices is that the utilization rate of gas plants is falling. This occurs because gas plants have to reduce their output when solar and wind power are available. When they do this, they lose revenue, while their fixed costs remain unchanged. Gas plants are thus providing ancillary services to solar and wind power by remaining on standby for times when the sun is not shining or the wind is not blowing. They are compensated for this to avoid bankruptcy.
California has installed 13,246 MW of lithium-ion utility-scale storage capacity. Using prices from the National Renewable Energy Lab (NREL) ATB 2024 report 10, the cost of this is 25.3 billion dollars. This accounts for about 6% of the difference in retail prices.
Rooftop solar has significantly driven up retail electricity prices. According to a report from the Public Advocates Office, a division of the California Public Utilities Commission, in 2024, Net Energy Metering (NEM) resulted in a $8.5 billion cost shift from rooftop solar customers to non-rooftop solar customers.11 Net metering allows rooftop solar customers to sell their surplus solar power back to their utility for the retail price of electricity.
Rooftop solar usage and net metering increase the cost of electricity for two reasons: rooftop solar customers avoid paying their fair share of the fixed costs for the electrical infrastructure they depend on, and utilities are required to pay a retail price for the rooftop solar power they are obligated to buy. Here is the principle behind the cost increase:
Cost Increase = (Self-Consumed Solar × Fixed Cost Rate) + (Exported Solar × (Retail Cost - Wholesale Cost))
Before we explain this equation, let’s start with a brief explanation of fixed costs and variable costs. Fixed costs are all the costs that must be funded regardless of how much electricity is consumed. Variable costs are the costs proportional to how much electricity is consumed. Nearly all the costs in Figure 13 are fixed costs. The only relevant variable cost is the cost of fuel for the gas and nuclear plants. These costs in California are less than 10% of the total. As of early 2025, California consumers pay fixed costs in direct proportion to their electricity consumption.
There are two parts to the equation above. The first half shows the amount that the rooftop solar customer avoids paying for the fixed costs. The self-consumed solar is the portion of rooftop solar that the customer uses, as opposed to what is exported back to the grid. This lowers the revenue paid to the utility by that amount times the portion of the electricity rate that is from fixed costs. However, the only savings to the system are the amount of gas and nuclear fuel that wasn’t consumed when the electricity from the rooftop solar was consumed instead. The utility must replace that lost revenue by raising prices.
The second half of the equation shows the amount of electricity the utility is forced to buy at retail prices. For example, if the retail price is 32 cents/kWh and the wholesale cost is 6 cents/kWh, the utility must buy the amount exported to the grid for 32 cents/kWh instead of only paying the usual 6 cents/kWh. Since the utility is now paying an extra 26 cents per kWh for the electricity it sells, and the cost to run its operations has not decreased, it must raise the price of everyone’s electricity to recoup the lost revenue.
Rooftop solar advocates sometimes rebut this by claiming that rooftop solar reduces the need for electrical infrastructure. It is true that rooftop solar can, in principle, reduce peak demand, which can reduce the amount of required electrical infrastructure. However, the value of rooftop solar for this is exaggerated compared to its high cost. Rooftop solar customers still require nearly all of the generation and transmission capacity to power their homes when the sun is setting, and their batteries are depleted. They also make heavier use of the distribution infrastructure when using it to sell the electricity generated on their roofs.
California has recently changed the rules so that new rooftop solar customers receive smaller payments for the solar energy they export. This is a partial fix and an acknowledgment of the problem; however, preexisting customers will continue to receive full retail prices for the electricity they export for a full 20 years. As a result, the new rules won’t lower prices due to the effects of net metering but merely reduce future price increases as rooftop solar expands.
The future cost of electricity
We have seen that solar power is the only source of energy that is seeing significant growth. Wind and gas power are growing slightly, while no other sources are growing at all. Nuclear power is politically unacceptable, and the other options are expensive or difficult. Building long-distance transmission lines over California’s rugged landscapes to reach resources out of state is not only expensive but can take more than 20 years to build a single line. This leaves in-state solar as the predominant option for future growth, combined with a small amount of new wind and geothermal.
If we extrapolate the current consumption trend and replace gas and in-state nuclear power, California will need an additional 235,000,000 MWh of new generation by 2045. That’s an amount equivalent to about 75% of what they currently consume. Note that this is not even close to what is needed to achieve true net zero by electrifying California’s entire economy. This is only enough to decarbonize electrical consumption, based on the current growth rate.
Figure 14 shows how the estimate is derived. Line 1 is the new consumption that must be satisfied, lines 2 and 3 are the gas and nuclear power that must be replaced, and line 4 is the total.

To satisfy the new consumption, California will need about 4 times more solar energy in the next 20 years, plus a smaller amount of wind and geothermal. Note that it took 15 years to get to the current level of solar energy consumption.
To have an idea of what this will cost, it’s essential to understand the cost dynamics of solar power. The most important basic concept is that the cost rises as the percentage of its use increases. When usage is below about 30% of consumption, the cost is easy to compute. We just use a simple Levelized Cost of Electricity (LCOE) formula.12 But as percentages go higher, the situation becomes more complicated.
Capacity factor is a key metric in determining the cost of electricity, making it essential to understand. It is the ratio of the actual energy produced by a power source over a given period to the maximum possible energy it could have generated if it operated at full capacity during that entire period. For solar power, the capacity factor is the actual energy output divided by the amount that would be produced if the sun never set and there were never any clouds.
The average annual capacity factor for California’s utility-scale solar plants is about 27%. For rooftop solar, it’s closer to 20%. We will refer to these capacity factors as the baselines. A capacity factor can fall below its baseline in the winter due to reduced sunshine or due to curtailment.
Curtailment is the surplus energy generated on sunny days that can’t be used either because there is not enough demand, or the power lines don’t have enough transmission capacity to transmit it. Curtailment is thus the amount of energy that is wasted. As the percentage of solar power increases, curtailment increases, and as curtailment increases, the capacity factor decreases.
LCOE calculates the cost of a power source in $/MWh by considering the interest rate, life of the project, capital cost, maintenance cost, capacity factor, and fuel cost. Dividing $/MWh by 10 converts it to the more familiar cents/kWh. This works great for dispatchable (reliable) energy, but fails for intermittent energy. This is because the cost of intermittent energy depends highly on how reliable it needs to be. The more reliable it has to be, the more expensive it is. To increase reliability, we must overbuild the capacity, deploy storage, expand transmission, and maintain an underutilized backup system. The basic LCOE does not account for these additional expenses.
The cost of solar power is inversely proportional to the capacity factor, meaning that if the capacity factor falls by 50%, the cost doubles. The baseline LCOE calculation uses 27% for the capacity factor. However, this is the average for the year. There are weeks when the capacity factor is higher, and weeks when it is much lower. For a solar or wind farm to be reliable, it must be designed to work in the worst-case conditions. Consequently, it must work during the week of the year with the lowest capacity factor.
Utility-scale solar power has not yet been a major factor in California’s higher electricity prices because, until recently, it was not expected to be reliable. As long as there is no curtailing or storage, and it receives the $27.5/MWh Production Tax Credit (PTC), it can compete with natural gas. However, the level of solar penetration has recently crossed a critical threshold. The curtailment rate in 2024 was 6.2% 13, and battery storage is just over 1 hour of consumption. Batteries are used to reduce curtailment, but they will not eliminate it.
This means that going forward, the LCOE calculation must use lower capacity factors than 27% and include the cost of storage. The current ratio of dispatchable to intermittent is about 65/35. As this ratio decreases, curtailment will rise, the capacity factors of the solar and gas plants will decrease, and the level of storage required will increase. All this means the cost of electricity will rise.
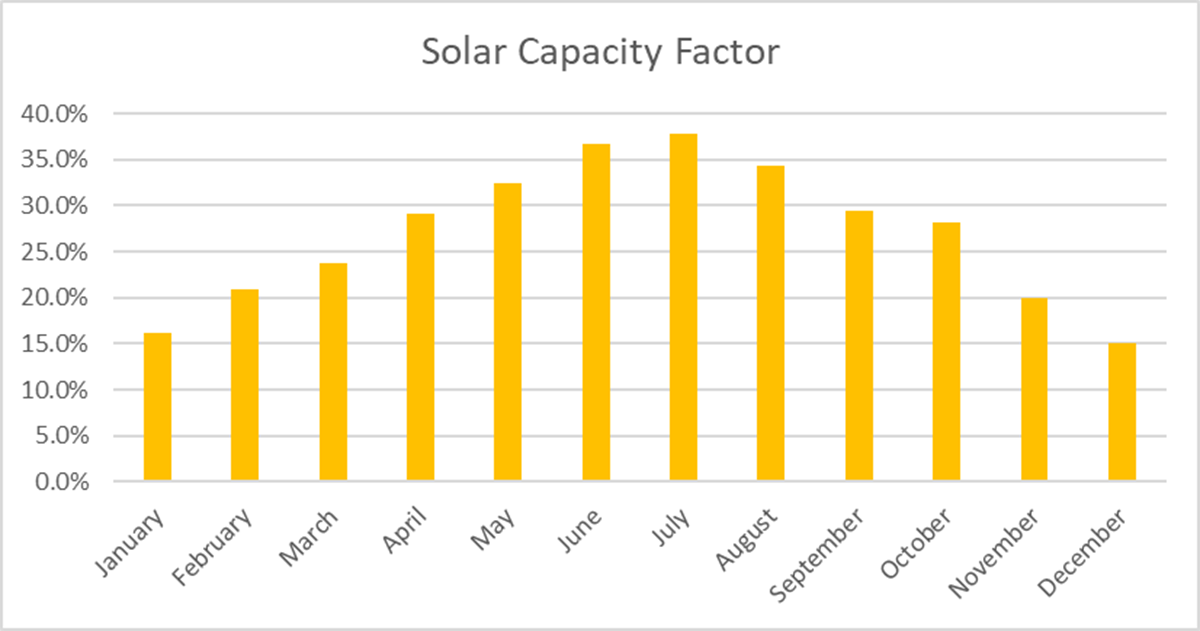
Figure 15 shows the monthly capacity factors of California’s solar farms calculated from EIA data. In the winter months, the capacity factor falls to 15%. There will be times during the year when it is lower yet. If we assume we have enough capacity for the solar farms to work reasonably well in the winter, we must use 15% or less as input for the LCOE calculations.
To compensate for when the capacity factor falls by 50%, we need an overbuild factor of 2. The overbuild factor is how much solar capacity is built with respect to the amount needed for average conditions. An adverse side effect of overbuilding is that during the spring and summer, we receive excessive energy, which leads to curtailment. We must also overbuild the storage capacity; less sunshine in the winter requires more batteries to keep the power on during the longer stretches of dim sunlight.
We claimed earlier that the amount of new solar energy California needs by 2045 is about 4 times the current level. This claim can be misleading because it implies that California needs to build 4 times as many solar farms as it currently has. But remember, the amount of energy a solar farm produces falls by 50% in the winter. Hence, to make solar reasonably reliable in the winter, California must build at least 8 times as many solar farms. To achieve this goal by 2045, starting immediately, California will have to increase the rate it builds solar farms by about 6 times.
Figure 16 below shows LCOE calculations for a variety of scenarios relevant to our analysis. The cost inputs for utility-scale power and storage are sourced from the EIA's 2025 Capital Cost Guide.14 Cost inputs for rooftop solar come from NREL ATB 2024.15 The interest rate for financing is assumed to be 8%.

The columns in black are the inputs for the LCOE calculations. The columns in red are the results. Column 4 shows the unsubsidized LCOE, while Column 5 shows the subsidized LCOE. The columns in blue are for hourly simulation. The goal of simulation is to predict the reliability of the configuration. Reliability is the percentage of time the power source can satisfy consumer demand. Details on the simulator can be found here.16
Column 2 contains the capacity factors used as inputs for the LCOE calculation. For utility-scale solar, 27% is the annual average, 15% is for winter, and 6.2% is measured by simulation when perfect reliability is achieved. For rooftop solar, the annual average is 20%, 10% is for winter, and 4.6% is measured by simulation when perfect reliability is achieved. Rooftop solar has a lower average capacity factor because the panels are at a fixed angle, as opposed to utility solar, which tracks the sun.
Column 6 indicates how much the solar capacity is overbuilt with respect to average demand. The overbuild factor, along with hours of storage, are the key inputs to the simulator. An overbuild factor of 1 is used for average conditions, and a factor of 2 is used for winter conditions. For rows 4, 8, and 12, the hours of storage and the overbuild factor are determined using optimization. Columns 7 and 8 are the results of the simulation: 7 shows the estimated curtailment, and 8 is the estimated reliability.
Observe rows 9 and 10, the capacity factor of a single gas plant is very high. However, the capacity factor of the entire fleet is very low. There are two reasons for this: first, there has to be a number of peaking plants whose sole purpose is to meet peak demand. These plants are offline most of the time. Second, solar and wind energy get priority over gas due to the way energy markets are structured. As the percentage of solar power rises, the capacity factor of gas will fall, raising its LCOE.
Looking at rows 1 through 4, the subsidized price of solar starts nearly the same as that of gas. However, it can only compete with gas when its capacity factor is high, it has no curtailing, no storage, receives subsidies, and no penalties are assessed for using gas plants for ancillary services. As we demand more reliability, the cost rises exponentially.
Rows 5 through 8 show the cost of rooftop solar. The LCOE of rooftop solar is about 3 times more expensive than utility-scale solar, and home batteries are about 3 times more costly than utility-scale batteries. One can be an advocate for utility-scale solar power and still question why we should promote a power source that is this expensive.
Nuclear energy is presented as an alternative. The cost in row 11 is the predicted LCOE by this MIT study referenced by the Department of Energy.17 The study projects that the cost of building AP1000 reactors will fall to $66/MWh after building 10 to 20 reactors. Row 12 is the cost if nuclear power is the sole source of power. In this case, it will have to be overbuilt to satisfy peak demand. Optimization shows that 1 hour of storage is ideal.
Figure 16 shows that as California expands its solar power capacity, the overall cost of generation will begin to rise sharply. A common rebuttal is that the cost of solar power and batteries will soon decline. While it is true that the price of solar modules and battery cells has fallen significantly over the years, the overall costs of constructing complete solar farms and battery storage systems have not decreased in the last 6 years: while module prices have dropped, the cost of other essential components, such as transformers, has increased.
Figure 17 shows the cost reported by the EIA for Battery Energy Storage Systems (BESS), and utility-scale solar plants over the last 6 years[.1819 20 21 22 The EIA did not issue a report in 2021. The cost trend is slightly rising, typical for a mature technology. Predicting the future cost of mature technologies with advanced supply chains is not much different than trying to predict the stock market.

Conclusion
Without an immediate and abrupt policy shift, California is not on a path to achieving its 2045 emissions goal. It’s impossible to predict how close they will get; it all depends on how much economic pain they can endure and how many ecosystems they are willing to sacrifice.
Looking at row 3 of Figure 16 (cost of solar at 95% reliability is $203/MWh), if they immediately accelerate utility-scale solar power installations by 6 times, they could achieve about a 95% reduction in CO₂ emissions by 2045. This will raise the cost of generation by roughly 15 cents/kWh. If rooftop solar use is significantly expanded and the planned 20 GW of floating offshore wind is built, the cost increase will be even higher. Additionally, transmission upgrades will add more costs on top of that. Without huge amounts of new CO2-free dispatchable power, a 100% reduction in CO₂ emissions is off the table (see row 4 of Figure 16, the cost of 100% reliable solar is $516/MWh).
Increasing generation costs by that much is particularly problematic for industry. Adding 15 cents/kWh to the current 20 cents/kWh brings the total to 35 cents/kWh. This is five times the current national average. Costs at this level will cause inflation and deindustrialization.
Retail prices will likely breach 50 cents/kWh. This will not only be painful for consumers, especially low-income consumers, but will also create a strong deterrent to decarbonizing elsewhere. For instance, EVs are cheaper to drive, but only if electricity is under 37 cents/kWh. High-speed charging stations are already higher than that. To operate heat pumps cost-competitive with gas furnaces, electricity needs to be around 18 cents/kWh. At 50 cents/kWh, heating becomes almost 3 times more expensive, that’s in addition to the higher upfront cost of the heat pump.
A key lesson for other regions is that solar power is a difficult path, even for a wealthy American state with sunny weather and deserts close to big cities. It will be even more difficult in other regions. For instance, New York State has a solar capacity factor of 19.5%, which means the cost of solar power there will be about 1.5 times higher than in California. And without deserts, finding locations for solar farms will be more difficult. Colder climates also have more severe heating needs. Tripling annual heating costs by switching to heat pumps will be more than a tough sell.
Another important lesson is that while rooftop solar has a compelling story to tell, the cost is extremely high. This high cost far exceeds the plausible benefit of a slight reduction in transmission infrastructure. Policies such as net metering encourage adoption, but they also drive up electricity prices when replacing a low-cost source of power with an expensive one. Furthermore, once these policies are in place, removing them is politically difficult.
Finally, decarbonization is much easier when the power source is dispatchable. We don’t have intermittency to manage, no need for large amounts of storage, there is no seasonal drop-off, less transmission is needed, an underutilized gas backup is not required, and land conflicts are minimized. These key technologies are nuclear, hydroelectric, biomass, and geothermal. However, the only one on that list that is universally scalable is nuclear energy. Geothermal energy has potential, but its supply is limited by geology.
The main criticism of nuclear power is its high cost. Nuclear power was once cheap and quick to build. With pro-nuclear policies, this could be true again.23 However, even with a higher LCOE than the baseline LCOE for solar power, skeptics of nuclear energy need to consider its high capacity factor and dispatchability. For solar or wind power to become even semi-dispatchable, they will need both extensive overbuilding and storage. Solar power advocates routinely overlook this obvious fact.
Policy makers need to realize that for deep decarbonization to be successful, the cost of clean electricity must be cheap.
Appendix: Glossary
This glossary provides definitions for key terms used in the paper, arranged alphabetically for easy reference. Definitions are tailored to the context of California's electricity transition and energy policy, drawing from standard industry usage.
Ancillary Services: Supportive functions provided by power plants (e.g., natural gas) to maintain grid stability, such as frequency regulation and voltage control, often required to back up intermittent renewable sources like solar and wind.
Battery Energy Storage System (BESS): A technology, typically using lithium-ion batteries, that stores electrical energy for later use, helping to balance supply and demand on the grid. In California, as of 2025, total capacity is around 15,763 MW, providing short-term storage (e.g., 2-4 hours).
Capacity Factor: The ratio of actual energy output from a power source over a period to its maximum possible output if operating at full capacity continuously. For example, California's utility-scale solar averages 27% annually, dropping to 15% in winter due to shorter days and weather.
California Energy Commission (CEC): A state agency responsible for energy policy, planning, and data collection in California, including tracking electricity imports and generation sources.
CO₂ Emissions (g/kWh): The amount of carbon dioxide released per kilowatt-hour of electricity generated or consumed, measuring the carbon intensity of a power grid. California's in-state consumption averages 192 g/kWh as of 2025, lower than the national average of 339 g/kWh.
Curtailment: The deliberate reduction or waste of renewable energy output (e.g., from solar or wind) when production exceeds demand or grid capacity, leading to lower effective capacity factors and higher costs as penetration increases.
Dispatchable Energy: Power sources that can be turned on, off, or adjusted reliably on demand, such as natural gas, nuclear, or geothermal, contrasting with intermittent renewables like solar and wind.
Energy Information Administration (EIA): A U.S. federal agency that collects, analyzes, and disseminates independent statistics on energy production, consumption, and emissions, serving as a primary data source for this paper.
Intermittency: The variable and unpredictable nature of renewable energy sources like solar (dependent on sunlight) and wind (dependent on weather) requires backups or storage to ensure a reliable electricity supply.
Investment Tax Credit (ITC): A U.S. federal tax incentive that reduces the cost of installing renewable energy systems, such as solar or geothermal, by allowing a percentage of the investment to be deducted from taxes.
Levelized Cost of Electricity (LCOE): A measure of the average net present cost of electricity generation over a power plant's lifetime, including capital, operations, maintenance, fuel, and capacity factors, expressed in $/MWh. It rises for intermittent sources at high penetration due to overbuilding and storage needs.
Megawatt-hour (MWh): A unit of electrical energy equal to one megawatt of power sustained for one hour, used to quantify consumption or generation. California consumed about 303,200,000 MWh in the last 12 months as of 2025.
Net Energy Metering (NEM): A billing mechanism allowing rooftop solar owners to receive credits for excess electricity exported to the grid at retail rates, often leading to cost shifts to non-solar customers (estimated at $8.5 billion in California in 2024).
NIMBYism (Not In My Backyard): Public opposition to infrastructure projects (e.g., transmission lines or wind farms) in local areas due to perceived negative impacts, delaying renewable energy development.
Overbuild Factor: The multiplier by which renewable capacity (e.g., solar farms) must exceed average demand to account for low-output periods like winter, ensuring reliability but increasing costs and curtailment.
Production Tax Credit (PTC): A U.S. federal incentive providing a per-kilowatt-hour tax credit for electricity generated from renewable sources like wind or solar, reducing effective costs (e.g., $27.5/MWh for solar in some scenarios).
Rooftop Solar: Photovoltaic panels installed on residential or commercial buildings, generating electricity for on-site use or export. It has a lower capacity factor (~20%) than utility-scale solar and contributes to higher retail prices via net metering.
Utility-Scale Solar: Large solar farms designed for grid-level electricity production, with higher efficiency (e.g., 27% capacity factor) than rooftop systems due to sun-tracking technology, but facing challenges like grid congestion and ecosystem impacts.
Wholesale vs. Retail Cost: Wholesale cost is the price utilities pay for bulk electricity generation (e.g., 6¢/kWh), while retail includes additional fixed costs like transmission and distribution (e.g., 32¢/kWh in California), highlighting inefficiencies in net metering.


Thank you for your comprehensive article regarding California electricity generation. One of the factors neglected by your analysis is the power engineering requirement for sufficient synchronous grid inertia (SGI) to maintain grid frequency stability. An introduction is found in this March 4, 2024 GreenNUKE article, "Why is Grid Inertia Important? Without sufficient synchronous grid inertia, the grid becomes unstable and a blackout occurs." https://greennuke.substack.com/p/why-is-grid-inertia-important One of nuclear's "superpowers" is the ability to supply abundant and necessary SGI. California's political leaders ignore this physical reality at their peril. Former California Governor Gray Davis was recalled in 2003 for his role in the ENRON-created blackouts in California.
Germany has pushed for increased use of solar and wind while turning off its large fleet of safe, reliable, and cost effective nuclear power plants. The result has been rising power sector emissions and radically higher electricity prices. On the other hand, France with its large nuclear power fleet (about 70% of demand) features lower electricity costs and significantly lower power sector emissions relative to Germany.
Another European nation that is following a course similar to Germany is Spain. Like California, Spain has abundant solar generation and a favorable climate. The Spanish PSOE government has pushed for high levels of subsidized solar and wind generation. Spain also has a unique tax on safe, reliable and cost-effective nuclear power to subsidize unreliable and intermittent solar and wind power. If the PSOE remains in power, Spain plans to shut down its seven nuclear reactors by 2035. However, on April 28, 2025, the Iberian Peninsula (Spain and Portugal) had a massive mid-day blackout. This blackout caused the death of eleven people. The lost productivity and damaged production equipment was denominated in the equivalent of billions of U.S. dollars. The unique Spanish nuclear tax was one of the causes of the blackout. See the July 8, 2025 GreenNUKE article, "The Spanish Version of the 'Duck Curve' is a real killer - This curve underscores the problem of insufficient synchronous grid inertia in Spain on April 28, 2025." https://greennuke.substack.com/p/the-spanish-version-of-the-duck-curve
A government decree for increased use of solar and wind eventually collides the the power engineering requirements for sufficient SGI summarized in the first paragraph above.
BTW, there is a natural experiment underway in California. I believe there would be a good correlation comparing the time series of the ratio of California's retail electric power cost to the national average retail electric power cost. This could be compared to the time series of per capita electricity use in California. California's exorbitant electricity costs diminish per capita electricity consumption.
Interesting read having worked inside the California energy system. There is also the public- private power battle that has always gone on in California with public power trying to stay independent from all the CAISO madness.